Who are the road.cc audience?
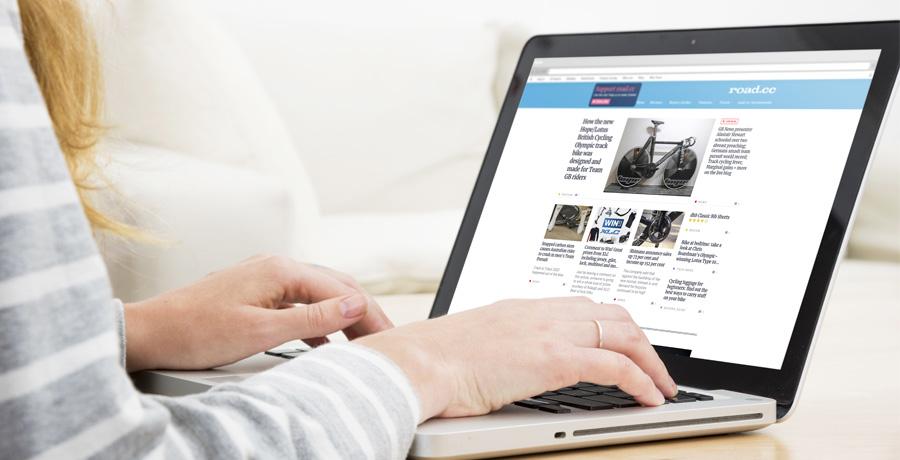
Over 2000 readers accepted our invitation to take part in our most recent reader survey, giving us a valuable insight into their habits when consuming content and indulging in their passion for cycling. Combining this with the ongoing data we collect from our Google Analytics statistics we're able to build up an image of the type of reader that frequents road.cc and how they engage with the website and it's content.
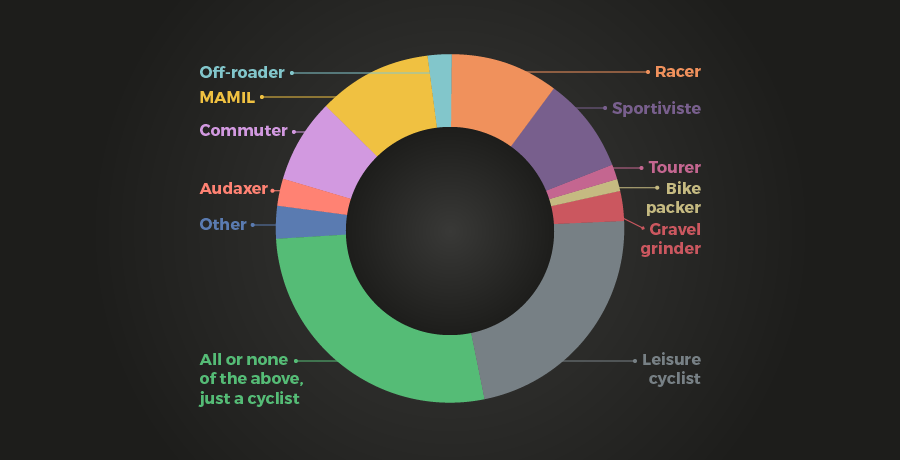
We kicked off the survey by asking readers what type of cyclist they identify as by selecting one option from a pre-defined list of riding types. As you can see from the results below and the graphic opposite just under a third of respondants went for the Just a cyclist option, with Leisure cyclist being the second most popular choice. Half of respondants were spread over a wide range of riding types, with Commuter, MAMIL, Racer, and Sportiviste standing out a popular answers.
Just a cyclist (all or none of the below) - 27.4%
Leisure cyclist - 22.31%
MAMIL - 10.77%
Racer - 10.05%
Sportiviste - 8.94%
Commuter - 7.69%
Gravel grinder - 2.93%
Other - 2.79%
Audaxer - 2.64%
Off-roader - 2.07%
Tourer - 1.44%
Bikepacker - 0.96%
Using the survey results and Google Analytics we're able to build up the picture of a typical road.cc reader. Google's data tells us that our core audience is predominantly male, making up 83% of the site's visitors.
According to our survey results, road.cc users are, in the majority, high earners. We asked our readers what their household income is, and the most frequent response was £100k+. The average is £75,000 which is inline with the top 80% of the UK population.
The results also show that on average our readers own 3.6 bikes each and have 1.4 cars per household.
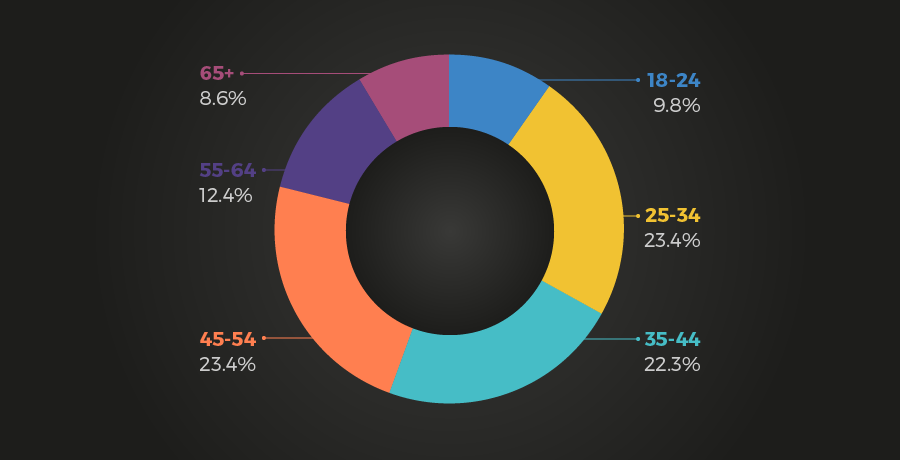
Google Analytics shows us that the core our audience falls into the broad age range of 25-54, with average age of a road.cc reader being 45 yrs old. See the graph opposite of a more detailed breakdown of age ranges.

The survey results show that the core of the audience active spenders looking for advice. Our respondents consider road.cc reviews the number one resource when considering a new bike purchase. We can see that 33% of respondants are looking to make a new bike purchase in the next 2 years and 63% will consider spending over £2000 on a new bike.
Google Analytics data shows us that out of all the site traffic 27% come direct to the site, but organic search is the most common channel for acquisition, with 53% of traffic coming to the site from search results.
In terms of content, the data show us that most valued features of the site in order of popularity are:
1) Reviews
2) News
3) Buyer’s Guides
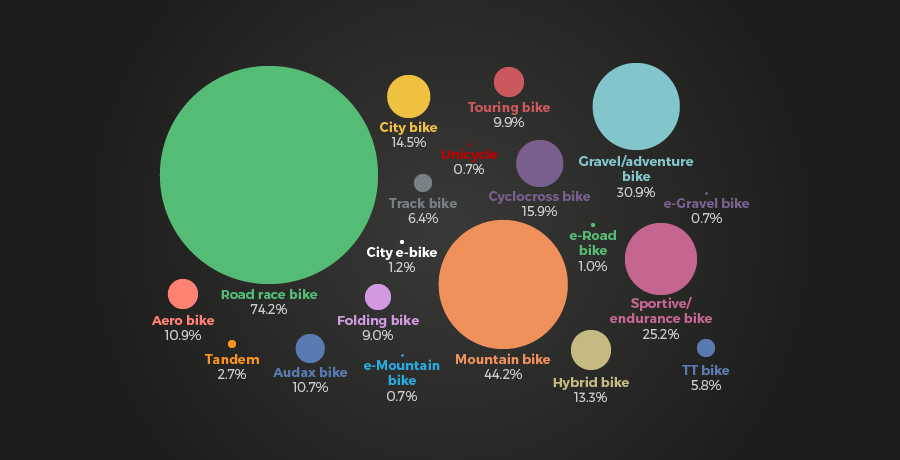
As we mentioned above, the survey results tell us that on average our respondents own 3.6 bikes, the majority of these own a road bike and the most popular second bike is a mountain bike.
As shown in the graphic, at least 1 in 10 own one of the following: Gravel/adventure bike (31%, 37% of high earners), Sportive bike (25%, 30% of high earners), Audax bike, Cyclocross bike, Aero road bike, Hybrid, Touring bike, or a City bike.
We asked readers what type of riding they do. The majority (56%) would say they are leisure riders, 46% commute, 38% ride indoors, 29% ride gravel, and 20% of respondants participate in mountain biking.
We asked our readers if they’re members of clubs and/or cycling organisations. Results show that 37% are members of clubs (31% of females), and 47% are members of cycling organisations (27% members of British Cycling).
When it comes to buying new bikes and gear the majority of our respondents said they buy a new bike every 3-5 years, and over 8% told us they got a new bike once a year or more.
On average they buy a new bike every 3.8 years, and would consider spending £3,086, over 12% say they’d spend £5000+ on a new bike.
The average annual spend of our respondents on cycle parts and accessories is £666, and for cycle clothing it’s £397.
When considering a new purchase, road.cc reviews are the number one destination for survey respondents, with 94% of them coming to road.cc to check our verdict before they part with their money.
We asked our readers which additional bike accessories and kit they own or use, over 80% of respondents own workshop tools, GPS cycling computers and dedicated bike cleaning products. 73% own a workstand and 63% use specialist cycling nutrition products.
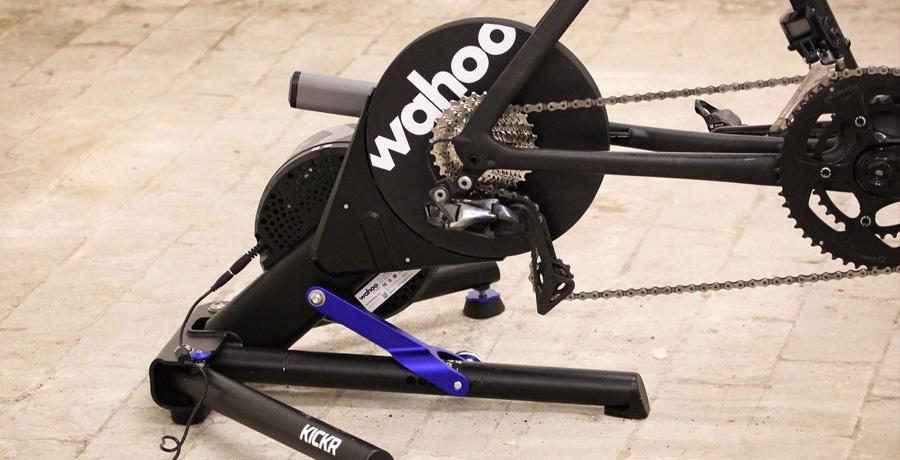
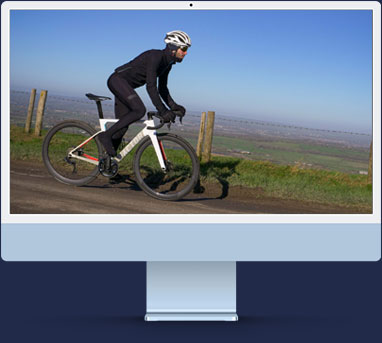
We asked if readers own a smart trainer, and 47% answered that they do, and a further 9% are considering buying one. By far and away the most popular smart training program is Zwift, with 63% of respondents saying they have used the platform. In second place is Sufferfest with 20% and in third Tacx with 19%.
Recording rides to track performance and share rides is increasingly becoming part and parcel of being a cyclist, as the results of our survey verified. 91% of readers surveyed track their rides, with the majority – more than 77% – using a dedicated GPS device, and 14% using a smartphone.